A practical case for moving beyond color-coded matrices toward decision-grade, quantitative risk thinking.
High-stakes decisions deserve better than pretty colors
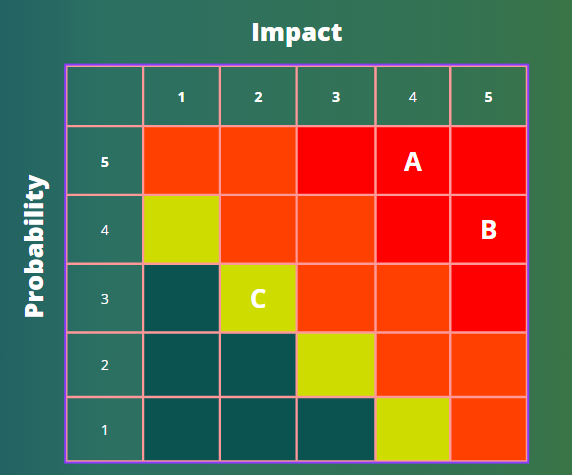
Executives don’t fund crews, change designs, or shift milestones based on vibes—they do it to protect value and keep objectives on track. Yet the familiar probability–impact matrix (the heat map) often gives a false sense of certainty. It looks scientific, but it can misdirect attention, dilute accountability, and push scarce resources to the wrong places.
Figure 1: What Heat Maps Miss - a tornado chart from quantitative analysis reveals the true sensitivity ranking of risk drivers
The hidden cost of color-coded certainty
Ranking by discrete buckets hides the true size of exposure. Consider two risks:
• Risk A: 40% likelihood, potential loss of $40M = expected losses of $16 M
• Risk B: 50% likelihood, potential loss of $16M= expected losses $8 Million
On a typical scorecard, Risk B can outrank Risk A—despite Risk A’s far larger financial threat. When scores outrun sense, budgets follow the wrong signals.
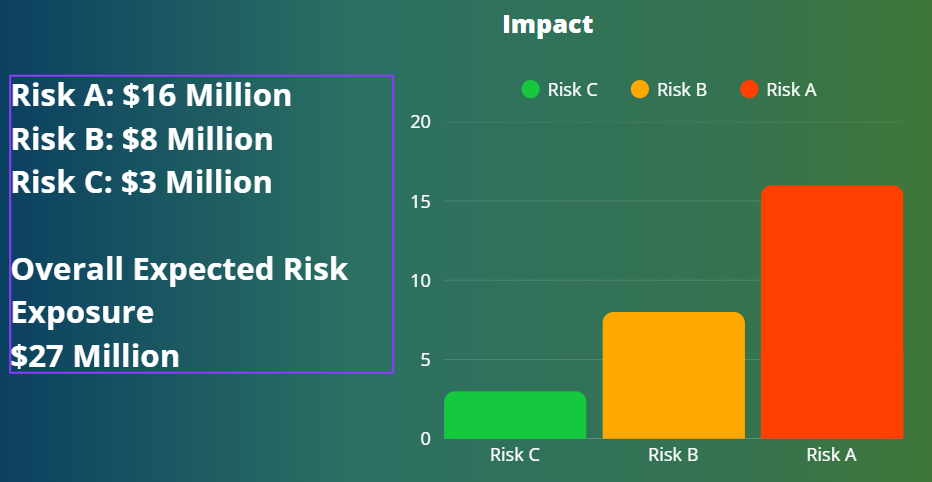
You can’t manage what you can’t sum
Heat maps list items; they don’t reveal the whole tank of exposure. Leaders need an answer to a basic question: “What’s the probable range of total cost and schedule impact?” If you can’t aggregate threats and the inherent variation around your estimates, you’re flying with a dashboard that omits the fuel gauge.
When opinions dress up as data
Qualitative workshops are valuable—but they’re also vulnerable. Without guardrails, group dynamics and incentives skew ratings. Typical distortions include:
• Anchoring – early numbers pull everything toward them.
• Conflicts of interest – risk registers get ‘weaponized’.
• Optimism/Pessimism – personalities tilt estimates.
• Familiarity – known risks feel safer than they are.
• Influence – senior voices bend consensus.
• Benefits bias – shiny upside masks genuine downside.
The result is a colorful chart that reflects the room, not the reality.
Another way—built for decisions
Decision-grade risk practice treats uncertainty as measurable. Quantitative Risk Assessment (QRA) integrates:
• Discrete risk events (may or may not occur).
• Business-as-usual uncertainties (the 100% certain variability around your
estimates).
These elements go into a Monte Carlo model that yields ranges and confidence levels for cost and schedule. Now leaders can size contingencies, set thresholds, and time responses based on measurable exposure—not graphic design.
A quick upgrade path for your team
1) Redefine each risk using a clear structure: due to (root cause) → there is a threat (what could happen) → resulting in (effect on objectives).
2) Separate risk events from estimate uncertainty; model both explicitly.
3) Build a minimal Monte Carlo model for the key cost and schedule drivers; start small and iterate.
4) Calibrate inputs with real data and expert elicitations that use ranges, not single-point guesses.
5) Report in percentiles (P50, P80, P90) and ranges, not colors; show how responses shift the distribution.
Governance guardrails: log assumptions, record rationales, and track ‘current controls’, ‘residual risk’, and ‘secondary risk’ after responses.
From insight to capability
If your organization is ready to move past heat maps and into measurable decision support, there is a structured path that develops the skillset end-to-end—from defining risks correctly to building integrated quantitative models and presenting results senior management can act on.
QRM Diploma + Ai