Written by Rami Salem, Quantitative Risk Management specialist with 15+ years of experience across oil and gas, EPC/EPCM, and infrastructure mega-projects.
Every Monte Carlo simulation ends with an S-curve. Every S-curve gives you a range of outcomes. And every project team faces the same question: which confidence level should we actually plan to?
P50? P80? P90? The answer is not a matter of preference. It is a strategic decision that should be driven by your organization's risk tolerance, the project's financial exposure, and the consequences of getting it wrong.
Most teams pick P80 because "that's what everyone uses." That is not a strategy. That is a habit. And habits cost projects millions when the reasoning behind them is never examined.
P50, P80, and P90 confidence levels are statistical thresholds from Monte Carlo simulation expressing the probability a project will finish within a given date or budget. P50 means 50% probability of achievement; P80 means 80%; P90 means 90%. They replace single-point estimates with a defensible range for setting contingency reserves.
This guide explains what each confidence level actually means in practice, when to use each one, and how IQRM recommends selecting the right level for your specific project context.
What P50, P80, and P90 Actually Mean
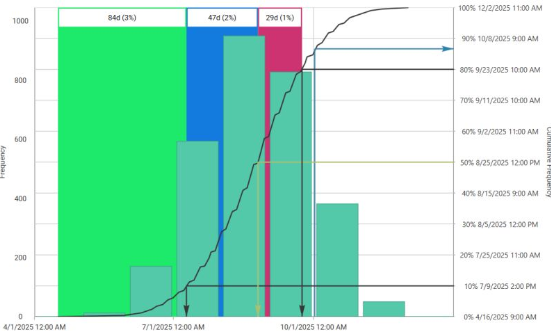
P-values are percentiles read directly from the cumulative distribution function (the S-curve) produced by a Monte Carlo simulation. Each value tells you the probability that your project outcome will not exceed a certain threshold.

Here is what each level represents in practical terms:
| Confidence Level | Probability of Achievement | What It Means in Practice |
|---|---|---|
| P10 | 10% | Extremely aggressive. Only 1 in 10 simulated outcomes achieved this. Almost never used for planning. |
| P50 | 50% | The median outcome. Half of all simulations finished earlier; half finished later. Often used as a contractor's aggressive internal target. |
| P80 | 80% | The industry standard for contingency planning. 8 out of 10 simulated outcomes achieved this. IQRM recommends P80 as the baseline for most project types. |
| P90 | 90% | Conservative. Used for high-stakes client commitments, regulatory submissions, and projects where overrun carries severe contractual penalties. |
| P95/P99 | 95-99% | Near-certain. Reserved for management reserve calculations and Black Swan threshold analysis. |
Key insight: The deterministic schedule date, the one sitting in your Primavera P6 or Microsoft Project file right now, typically falls between P5 and P20 on the S-curve. That means most project plans have only a 5-20% chance of being achieved as written. The gap between that P15 date and P80 is your contingency requirement.
Why Your Deterministic Schedule Is Probably at P15
This surprises most project teams, but it should not. Deterministic schedules are built on single-point duration estimates. Those estimates carry an inherent optimism bias: teams estimate what they hope will happen, not what historically does happen.

When IQRM runs a Quantitative Schedule Risk Analysis (QSRA) on a project, the first output that matters is where the deterministic finish date lands on the S-curve. If it falls at P15, the team has been planning with a plan that has an 85% chance of being exceeded.
This is not a failure of the planning team. It is a structural feature of deterministic planning. Single-point estimates cannot capture the full range of uncertainty that exists in any complex project. That is why Monte Carlo simulation exists: to model that uncertainty explicitly and produce a probability distribution of possible outcomes.
The question is not whether your plan is optimistic. It almost certainly is. The question is: how much contingency do you add, and which confidence level justifies that contingency?
When to Use P50: Aggressive Targets and Contractor Baselines
P50 is the median outcome. It is the point where you have an equal chance of finishing earlier or later. Using P50 as your planning target means accepting a coin flip: 50% of the time, you will overrun.
P50 is appropriate when:
- A contractor is setting an internal stretch target to motivate performance, knowing that overrun is absorbed by their own contingency reserve
- The project sponsor has explicitly accepted a risk-neutral position (equal comfort with overrun and underrun)
- The organization's calculated risk tolerance is high enough to absorb the financial consequences of a 50% overrun probability
P50 is dangerous when:
- The number is being presented to a client as a commitment date
- There is no contingency reserve behind it
- The project carries liquidated damages or penalty clauses triggered by late delivery
IQRM's experience across GCC mega-projects shows that P50 dates presented as commitments are a leading cause of claim disputes and stakeholder conflict. The date looks achievable on paper, but it carries a built-in 50% failure rate that is rarely communicated to the people making decisions based on it.
When to Use P80: The Industry Standard for Contingency Sizing
P80 is the most widely used confidence level for project planning and contingency sizing. It provides an 80% probability of achievement, meaning only 2 out of 10 simulated scenarios exceeded this threshold.
Why P80 is the default:
- It balances confidence with cost. P80 provides strong assurance without the premium of P90 or P95 funding.
- It aligns with risk-averse decision-making. Most project sponsors prefer to fund at a level where the probability of success is substantially higher than a coin flip.
- It is the standard referenced by AACE International, many government agencies, and the UK Ministry of Defence for contingency calculations.
- It matches the risk appetite of most organizations: willing to accept a 20% chance of overrun as an acceptable residual risk.
IQRM recommends P80 as the starting point for contingency sizing on most projects. The cost risk analysis and contingency sizing process produces the P80 cost directly from the simulation S-curve, and the difference between the base estimate and P80 becomes the recommended schedule contingency reserve.
Key insight: P80 is not "the base estimate plus 20%." P80 is a specific point on the cumulative probability distribution. Its distance from the base estimate depends entirely on the level of uncertainty in the project. A project with tightly defined scope and historical data may have a P80 that is 5% above the base. A project with high uncertainty may have a P80 that is 40% above the base. The simulation determines the number, not a percentage rule of thumb.
When to Use P90: High-Stakes Commitments and Regulatory Submissions
P90 provides 90% confidence. Only 1 in 10 simulated outcomes exceeded this value. It is the most conservative level commonly used in project planning.
P90 is appropriate when:
- The project involves contractual commitments with severe penalties for overrun (liquidated damages, performance bonds)
- A regulatory body requires high-confidence forecasts (the UK MoD requires P10, P50, and P90 in business cases for major projects)
- The organization's risk tolerance is low, typically smaller firms or those with tight margins where a single project overrun could threaten financial viability
- Client-facing milestone dates that, if missed, trigger cascading impacts across a portfolio of interdependent projects
The trade-off with P90:
Higher confidence costs more. The difference between P80 and P90 contingency can be substantial, sometimes representing weeks of additional schedule float or millions in additional budget. Organizations must weigh whether the incremental confidence justifies the incremental cost.
IQRM's decision theory framework uses stochastic dominance and utility theory to make this trade-off mathematically defensible rather than subjective.
The IQRM Confidence Level Selection Framework
Choosing between P50, P80, and P90 should not be a gut decision. IQRM recommends a structured approach based on three factors:

1. Organizational Risk Tolerance (RT)
Risk tolerance is a dollar value representing the maximum amount an organization is willing to risk on a single project gamble. It is calibrated to the organization's financial capacity and strategic position. Enterprise choices on whether to fund at P50, P80, or P90 are directly reverse-engineered from the organization's calculated RT boundaries. A higher RT supports P50 or P80 funding. A lower RT demands P80 or P90.
2. Contractual Exposure
Projects with liquidated damages, milestone-linked payments, or performance bonds need higher confidence levels. The cost of overrun is not just the contingency shortfall; it includes penalties, claims, and reputational damage. For these projects, IQRM recommends P80 as a minimum, with P90 for critical client-facing milestones.
3. Consequence Severity
What happens if the project exceeds this confidence level? If the consequence is an internal schedule slip that can be recovered, P50 may be acceptable. If the consequence is a regulatory violation, a contract termination, or a safety-critical delay, P90 is the defensible choice.
| Factor | Points Toward P50 | Points Toward P80 | Points Toward P90 |
|---|---|---|---|
| Risk Tolerance | High (large portfolio, strong balance sheet) | Moderate | Low (single project, tight margins) |
| Contractual Exposure | Internal targets only | Standard contracts, moderate penalties | Severe LD clauses, performance bonds |
| Consequence of Overrun | Recoverable schedule slip | Budget reallocation required | Regulatory, safety, or existential impact |
| Historical Data Quality | Strong benchmarks available | Mixed data quality | Limited or no historical data |
| Stakeholder Expectations | Internal team only | Board or sponsor reporting | External client or regulator commitment |
This is the IQRM Confidence Level Selection Framework. Apply it at the start of any risk analysis to ensure the chosen confidence level is aligned with the project's actual risk profile, not just inherited from the last project.
Common Mistakes When Using Confidence Levels
Mistake 1: Treating P80 as "base estimate plus a percentage."
P80 is a simulation output, not a formula. It depends on the uncertainty modeled in the project. Two projects with the same base cost can have vastly different P80 values if their risk profiles differ.
Mistake 2: Presenting P50 to clients as a "realistic" completion date.
P50 is a median, not a commitment. It has a 50% probability of being exceeded. Calling it "realistic" without disclosing the probability is misleading and a frequent source of project disputes.
Mistake 3: Using the same confidence level for every project.
A routine brownfield maintenance project does not carry the same risk profile as a greenfield mega-project. The confidence level should be calibrated to the specific project's exposure, not applied as a blanket policy.
Mistake 4: Ignoring the gap between deterministic and P50.
The distance from your P6 date to even P50 reveals the embedded optimism in your schedule. If you are not measuring this gap, you are not managing schedule risk; you are ignoring it.
Frequently Asked Questions
What is P50 P80 P90 in risk analysis?
P50, P80, and P90 are confidence levels derived from Monte Carlo simulation. P50 means there is a 50% probability the project will finish on or before that date or cost. P80 means 80% probability. P90 means 90% probability. They are read from the cumulative distribution function (S-curve) produced by the simulation.
How do you choose between P50, P80, and P90?
The choice depends on three factors: your organization's risk tolerance, the contractual exposure of the project, and the severity of consequences if the target is exceeded. IQRM recommends using a structured framework rather than defaulting to a single level across all projects.
What is the P80 confidence level in project management?
P80 is a statistical threshold indicating an 80% probability that the project outcome (cost or schedule) will not exceed the stated value. It is the industry standard for contingency sizing, recommended by AACE International and used by most government and private sector organizations as the basis for budget and schedule reserves.
Why does the deterministic schedule usually fall at P15?
Deterministic schedules use single-point estimates that carry inherent optimism bias. When these estimates are stress-tested through Monte Carlo simulation, the planned finish date typically achieves only a 5-20% probability, revealing that the plan was built on best-case assumptions rather than realistic probability ranges.
What is risk tolerance and how does it affect confidence level selection?
Risk tolerance is a calculated dollar value representing the maximum financial risk an organization is willing to accept on a single gamble. Organizations with high risk tolerance can fund at P50 or P80. Those with low risk tolerance should fund at P80 or P90. The confidence level is reverse-engineered from the RT calculation, not chosen arbitrarily.
Is P80 always the right choice for project contingency?
No. P80 is a strong default for most projects, but it is not universally correct. Projects with severe contractual penalties, regulatory requirements, or low organizational risk tolerance may require P90. Internal stretch targets may use P50. The right choice depends on the specific project context, which is why IQRM developed the Confidence Level Selection Framework.
Make Confidence Level Decisions That Are Defensible
The difference between a well-chosen confidence level and an arbitrary one is the difference between a contingency reserve that protects the project and one that either bankrupts the bid or leaves the project exposed.
IQRM's QRM Professional Diploma teaches practitioners how to run Monte Carlo simulations, interpret S-curves, and apply the decision frameworks (stochastic dominance, utility theory, and the Confidence Level Selection Framework) that turn simulation outputs into defensible business decisions.
Stop guessing which P-value to use. Start calculating it.
Written by Rami Salem, Quantitative Risk Management specialist with 15+ years of experience across oil and gas, EPC/EPCM, and infrastructure mega-projects.
Every Monte Carlo simulation ends with an S-curve. Every S-curve gives you a range of outcomes. And every project team faces the same question: which confidence level should we actually plan to?
P50? P80? P90? The answer is not a matter of preference. It is a strategic decision that should be driven by your organization's risk tolerance, the project's financial exposure, and the consequences of getting it wrong.
Most teams pick P80 because "that's what everyone uses." That is not a strategy. That is a habit. And habits cost projects millions when the reasoning behind them is never examined.
P50, P80, and P90 confidence levels are statistical thresholds from Monte Carlo simulation expressing the probability a project will finish within a given date or budget. P50 means 50% probability of achievement; P80 means 80%; P90 means 90%. They replace single-point estimates with a defensible range for setting contingency reserves.
This guide explains what each confidence level actually means in practice, when to use each one, and how IQRM recommends selecting the right level for your specific project context.
What P50, P80, and P90 Actually Mean
P-values are percentiles read directly from the cumulative distribution function (the S-curve) produced by a Monte Carlo simulation. Each value tells you the probability that your project outcome will not exceed a certain threshold.
Here is what each level represents in practical terms:
| Confidence Level | Probability of Achievement | What It Means in Practice |
|---|---|---|
| P10 | 10% | Extremely aggressive. Only 1 in 10 simulated outcomes achieved this. Almost never used for planning. |
| P50 | 50% | The median outcome. Half of all simulations finished earlier; half finished later. Often used as a contractor's aggressive internal target. |
| P80 | 80% | The industry standard for contingency planning. 8 out of 10 simulated outcomes achieved this. IQRM recommends P80 as the baseline for most project types. |
| P90 | 90% | Conservative. Used for high-stakes client commitments, regulatory submissions, and projects where overrun carries severe contractual penalties. |
| P95/P99 | 95-99% | Near-certain. Reserved for management reserve calculations and Black Swan threshold analysis. |
Key insight: The deterministic schedule date, the one sitting in your Primavera P6 or Microsoft Project file right now, typically falls between P5 and P20 on the S-curve. That means most project plans have only a 5-20% chance of being achieved as written. The gap between that P15 date and P80 is your contingency requirement.
Why Your Deterministic Schedule Is Probably at P15
This surprises most project teams, but it should not. Deterministic schedules are built on single-point duration estimates. Those estimates carry an inherent optimism bias: teams estimate what they hope will happen, not what historically does happen.
When IQRM runs a Quantitative Schedule Risk Analysis (QSRA) on a project, the first output that matters is where the deterministic finish date lands on the S-curve. If it falls at P15, the team has been planning with a plan that has an 85% chance of being exceeded.
This is not a failure of the planning team. It is a structural feature of deterministic planning. Single-point estimates cannot capture the full range of uncertainty that exists in any complex project. That is why Monte Carlo simulation exists: to model that uncertainty explicitly and produce a probability distribution of possible outcomes.
The question is not whether your plan is optimistic. It almost certainly is. The question is: how much contingency do you add, and which confidence level justifies that contingency?
When to Use P50: Aggressive Targets and Contractor Baselines
P50 is the median outcome. It is the point where you have an equal chance of finishing earlier or later. Using P50 as your planning target means accepting a coin flip: 50% of the time, you will overrun.
P50 is appropriate when:
- A contractor is setting an internal stretch target to motivate performance, knowing that overrun is absorbed by their own contingency reserve
- The project sponsor has explicitly accepted a risk-neutral position (equal comfort with overrun and underrun)
- The organization's calculated risk tolerance is high enough to absorb the financial consequences of a 50% overrun probability
P50 is dangerous when:
- The number is being presented to a client as a commitment date
- There is no contingency reserve behind it
- The project carries liquidated damages or penalty clauses triggered by late delivery
IQRM's experience across GCC mega-projects shows that P50 dates presented as commitments are a leading cause of claim disputes and stakeholder conflict. The date looks achievable on paper, but it carries a built-in 50% failure rate that is rarely communicated to the people making decisions based on it.
When to Use P80: The Industry Standard for Contingency Sizing
P80 is the most widely used confidence level for project planning and contingency sizing. It provides an 80% probability of achievement, meaning only 2 out of 10 simulated scenarios exceeded this threshold.
Why P80 is the default:
- It balances confidence with cost. P80 provides strong assurance without the premium of P90 or P95 funding.
- It aligns with risk-averse decision-making. Most project sponsors prefer to fund at a level where the probability of success is substantially higher than a coin flip.
- It is the standard referenced by AACE International, many government agencies, and the UK Ministry of Defence for contingency calculations.
- It matches the risk appetite of most organizations: willing to accept a 20% chance of overrun as an acceptable residual risk.
IQRM recommends P80 as the starting point for contingency sizing on most projects. The cost risk analysis and contingency sizing process produces the P80 cost directly from the simulation S-curve, and the difference between the base estimate and P80 becomes the recommended contingency reserve.
Key insight: P80 is not "the base estimate plus 20%." P80 is a specific point on the cumulative probability distribution. Its distance from the base estimate depends entirely on the level of uncertainty in the project. A project with tightly defined scope and historical data may have a P80 that is 5% above the base. A project with high uncertainty may have a P80 that is 40% above the base. The simulation determines the number, not a percentage rule of thumb.
When to Use P90: High-Stakes Commitments and Regulatory Submissions
P90 provides 90% confidence. Only 1 in 10 simulated outcomes exceeded this value. It is the most conservative level commonly used in project planning.
P90 is appropriate when:
- The project involves contractual commitments with severe penalties for overrun (liquidated damages, performance bonds)
- A regulatory body requires high-confidence forecasts (the UK MoD requires P10, P50, and P90 in business cases for major projects)
- The organization's risk tolerance is low, typically smaller firms or those with tight margins where a single project overrun could threaten financial viability
- Client-facing milestone dates that, if missed, trigger cascading impacts across a portfolio of interdependent projects
The trade-off with P90:
Higher confidence costs more. The difference between P80 and P90 contingency can be substantial, sometimes representing weeks of additional schedule float or millions in additional budget. Organizations must weigh whether the incremental confidence justifies the incremental cost.
IQRM's decision theory framework uses stochastic dominance and utility theory to make this trade-off mathematically defensible rather than subjective.
The IQRM Confidence Level Selection Framework
Choosing between P50, P80, and P90 should not be a gut decision. IQRM recommends a structured approach based on three factors:
1. Organizational Risk Tolerance (RT)
Risk tolerance is a dollar value representing the maximum amount an organization is willing to risk on a single project gamble. It is calibrated to the organization's financial capacity and strategic position. Enterprise choices on whether to fund at P50, P80, or P90 are directly reverse-engineered from the organization's calculated RT boundaries. A higher RT supports P50 or P80 funding. A lower RT demands P80 or P90.
2. Contractual Exposure
Projects with liquidated damages, milestone-linked payments, or performance bonds need higher confidence levels. The cost of overrun is not just the contingency shortfall; it includes penalties, claims, and reputational damage. For these projects, IQRM recommends P80 as a minimum, with P90 for critical client-facing milestones.
3. Consequence Severity
What happens if the project exceeds this confidence level? If the consequence is an internal schedule slip that can be recovered, P50 may be acceptable. If the consequence is a regulatory violation, a contract termination, or a safety-critical delay, P90 is the defensible choice.
| Factor | Points Toward P50 | Points Toward P80 | Points Toward P90 |
|---|---|---|---|
| Risk Tolerance | High (large portfolio, strong balance sheet) | Moderate | Low (single project, tight margins) |
| Contractual Exposure | Internal targets only | Standard contracts, moderate penalties | Severe LD clauses, performance bonds |
| Consequence of Overrun | Recoverable schedule slip | Budget reallocation required | Regulatory, safety, or existential impact |
| Historical Data Quality | Strong benchmarks available | Mixed data quality | Limited or no historical data |
| Stakeholder Expectations | Internal team only | Board or sponsor reporting | External client or regulator commitment |
This is the IQRM Confidence Level Selection Framework. Apply it at the start of any risk analysis to ensure the chosen confidence level is aligned with the project's actual risk profile, not just inherited from the last project.
Common Mistakes When Using Confidence Levels
Mistake 1: Treating P80 as "base estimate plus a percentage."
P80 is a simulation output, not a formula. It depends on the uncertainty modeled in the project. Two projects with the same base cost can have vastly different P80 values if their risk profiles differ.
Mistake 2: Presenting P50 to clients as a "realistic" completion date.
P50 is a median, not a commitment. It has a 50% probability of being exceeded. Calling it "realistic" without disclosing the probability is misleading and a frequent source of project disputes.
Mistake 3: Using the same confidence level for every project.
A routine brownfield maintenance project does not carry the same risk profile as a greenfield mega-project. The confidence level should be calibrated to the specific project's exposure, not applied as a blanket policy.
Mistake 4: Ignoring the gap between deterministic and P50.
The distance from your P6 date to even P50 reveals the embedded optimism in your schedule. If you are not measuring this gap, you are not managing schedule risk; you are ignoring it.
Frequently Asked Questions
What is P50 P80 P90 in risk analysis?
P50, P80, and P90 are confidence levels derived from Monte Carlo simulation. P50 means there is a 50% probability the project will finish on or before that date or cost. P80 means 80% probability. P90 means 90% probability. They are read from the cumulative distribution function (S-curve) produced by the simulation.
How do you choose between P50, P80, and P90?
The choice depends on three factors: your organization's risk tolerance, the contractual exposure of the project, and the severity of consequences if the target is exceeded. IQRM recommends using a structured framework rather than defaulting to a single level across all projects.
What is the P80 confidence level in project management?
P80 is a statistical threshold indicating an 80% probability that the project outcome (cost or schedule) will not exceed the stated value. It is the industry standard for contingency sizing, recommended by AACE International and used by most government and private sector organizations as the basis for budget and schedule reserves.
Why does the deterministic schedule usually fall at P15?
Deterministic schedules use single-point estimates that carry inherent optimism bias. When these estimates are stress-tested through Monte Carlo simulation, the planned finish date typically achieves only a 5-20% probability, revealing that the plan was built on best-case assumptions rather than realistic probability ranges.
What is risk tolerance and how does it affect confidence level selection?
Risk tolerance is a calculated dollar value representing the maximum financial risk an organization is willing to accept on a single gamble. Organizations with high risk tolerance can fund at P50 or P80. Those with low risk tolerance should fund at P80 or P90. The confidence level is reverse-engineered from the RT calculation, not chosen arbitrarily.
Is P80 always the right choice for project contingency?
No. P80 is a strong default for most projects, but it is not universally correct. Projects with severe contractual penalties, regulatory requirements, or low organizational risk tolerance may require P90. Internal stretch targets may use P50. The right choice depends on the specific project context, which is why IQRM developed the Confidence Level Selection Framework.
Make Confidence Level Decisions That Are Defensible
The difference between a well-chosen confidence level and an arbitrary one is the difference between a contingency reserve that protects the project and one that either bankrupts the bid or leaves the project exposed.
IQRM's QRM Professional Diploma teaches practitioners how to run Monte Carlo simulations, interpret S-curves, and apply the decision frameworks (stochastic dominance, utility theory, and the Confidence Level Selection Framework) that turn simulation outputs into defensible business decisions.
Stop guessing which P-value to use. Start calculating it.